Have you ever walked down the street, seen someone walking their dog, and thought to yourself “Gee, I sure wish someone would write a blog post examining trends in the Seattle Pet Licenses dataset and post it online for me to read”? If so, 1) wow, that’s a crazy coincidence and 2) you’re in just the right place. This project uses both data from Seattle Open Data’s pet license dataset and 2022 U.S. Census data to try and get a birds-eye-view on just how we share the Emerald City with our furry friends.
The Data
The Seattle Pet Licenses dataset is created from user-entered data on pet license applications. Each column in the set refers to a different value entered by a user when applying for or renewing a pet license. Some of these values, such as Name and ZIP Code, can be freely entered by the user. Others, like Species, prompt the user to select from a predefined list of values. The restriction on values for Species is particularly important to the dataset; it means that pets that aren’t dogs, cats, pigs or goats are entirely absent from the data. The free-text ZIP code field has also affected the data; several entries have ZIP codes that were entered incorrectly and cannot be attributed to a physical location. Primary and secondary breed data may also be inaccurate, particularly from owners who have adopted or rescued their pets.
Concerns & Limitations
While pet licenses have been required by law in Seattle since 1985, this dataset only covers the last seven years. Anyone wishing to do more significant historical research on Seattle pets will have to look elsewhere; this data is best suited for analysis of contemporary trends.
It is unclear how strictly license requirements are enforced. Applying for a pet license requires users to pay a fee, which means that pets from socioeconomically disadvantaged houses may be less likely to appear in the dataset. In general, this dataset cannot be treated like a 100% complete list of pets in the Seattle area. It is likely that there are a significant number of pet owners who either are not aware of the pet license requirement or simply choose not to apply. Therefore, this dataset is at best a representative sample of Seattle pet demographics.
Much of the data present in this dataset may be personally identifiable. For pet owners who have given their animals particularly unique names, their pet license data may be attributed back to them. For example, my cat Phoncible appears to be the only Phoncible in the entire database, and therefore I know which row is associated with my data. I doubt the majority of Seattle pet license owners are aware this data is publicly available, which some may find concerning. I doubt it would be a major issue, though; the information provided in this dataset is pretty vague and likely is not a serious privacy concern.
One final limitation: unfortunately, while this dataset does contain entries for pigs and goats, there are only about 20 of them in total, which is far too small a sample for any real analysis. Therefore, all the following facts and figures pertain exclusively to cats and dogs.
Analysis
Part I: Names
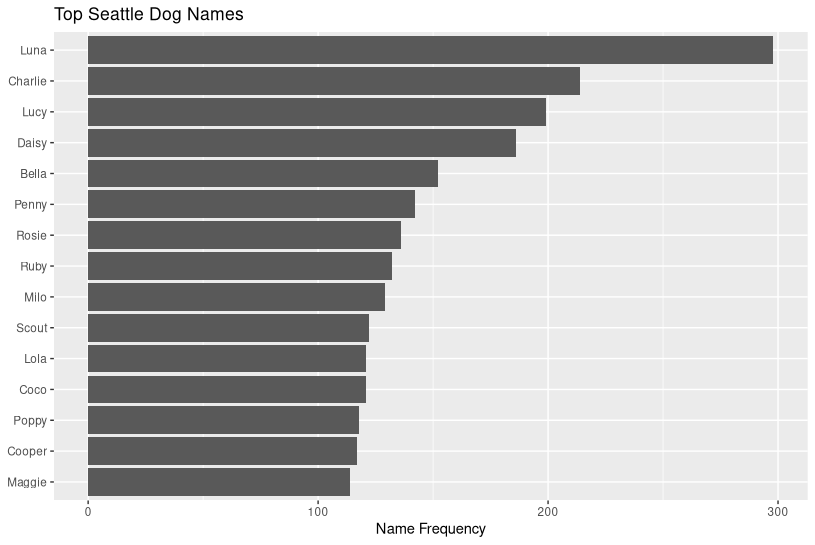
Enough of all that - let’s get to the meat of the whole thing. I started my analysis by taking a look at pet names. Here are the top 15 most popular pet names for dogs:
and the same for cats:
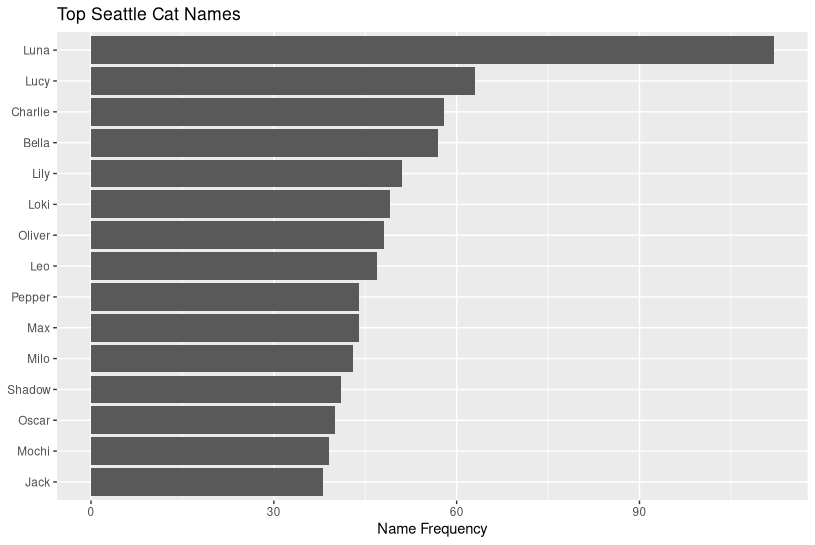
I was surprised to see the top 3 being the same (albeit in a slightly different order) across both species. In both cases, Luna was solidly in the lead, particularly for cats. Honorable mentions for cross-species popularity go to Bella and Milo.
The distribution of names is fairly similar here. I was curious to see if pet name popularity would operate in a similar way to English word popularity. If you’re not familiar with Zipf’s law, it’s an observed pattern in which words in a corpus of natural (spoken or written) language tend to decrease in frequency where the frequency of the nth most popular word is 1/nth as frequent as the most frequent word. In other words, the second most popular word occurs half as often as the most popular word, the third most popular word occurs a third as often as the most popular, and so on down the line. That is far from the case here. I’m no linguist but I suspect this has something to do with the fact that 1) pet names are chosen by owners, not naturally occurring and 2) pet owners are likely influenced by others when choosing a pet name and may gravitate toward names they’re already familiar with.
Just to check, I also created a plot of the top 25 most popular pet names across the entire dataset. Zipf fails again.
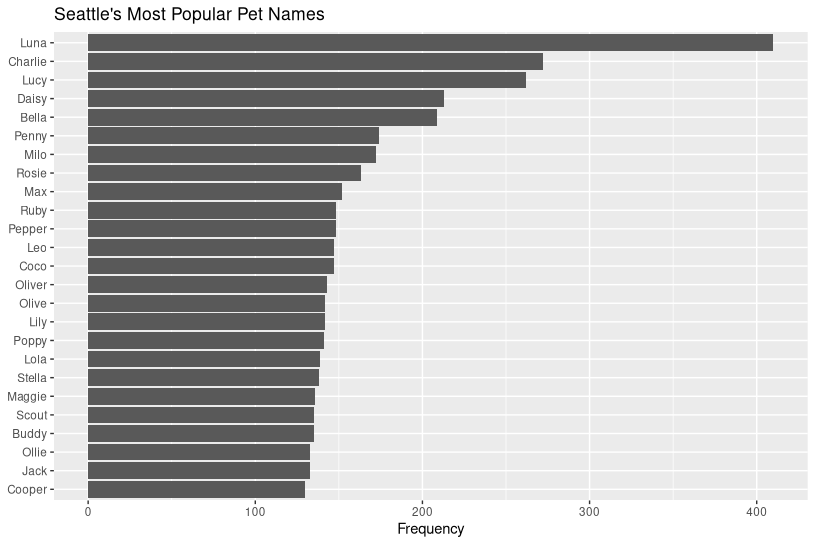
I was also curious as to whether cats or dogs were more likely to have unique names. To get a sense of this, I summed the amount of pets with the top 50 most popular names for their species and then divided that by the total number of licenses (again, for their species. Here are the results: ~19% of cats have a top-50 name, while that figure hovers around 26% for dogs. Calling that a win for cat owners.
(One side note: I checked the dataset, and my cat is the only registered Phoncible in the city. I’m doing my part).
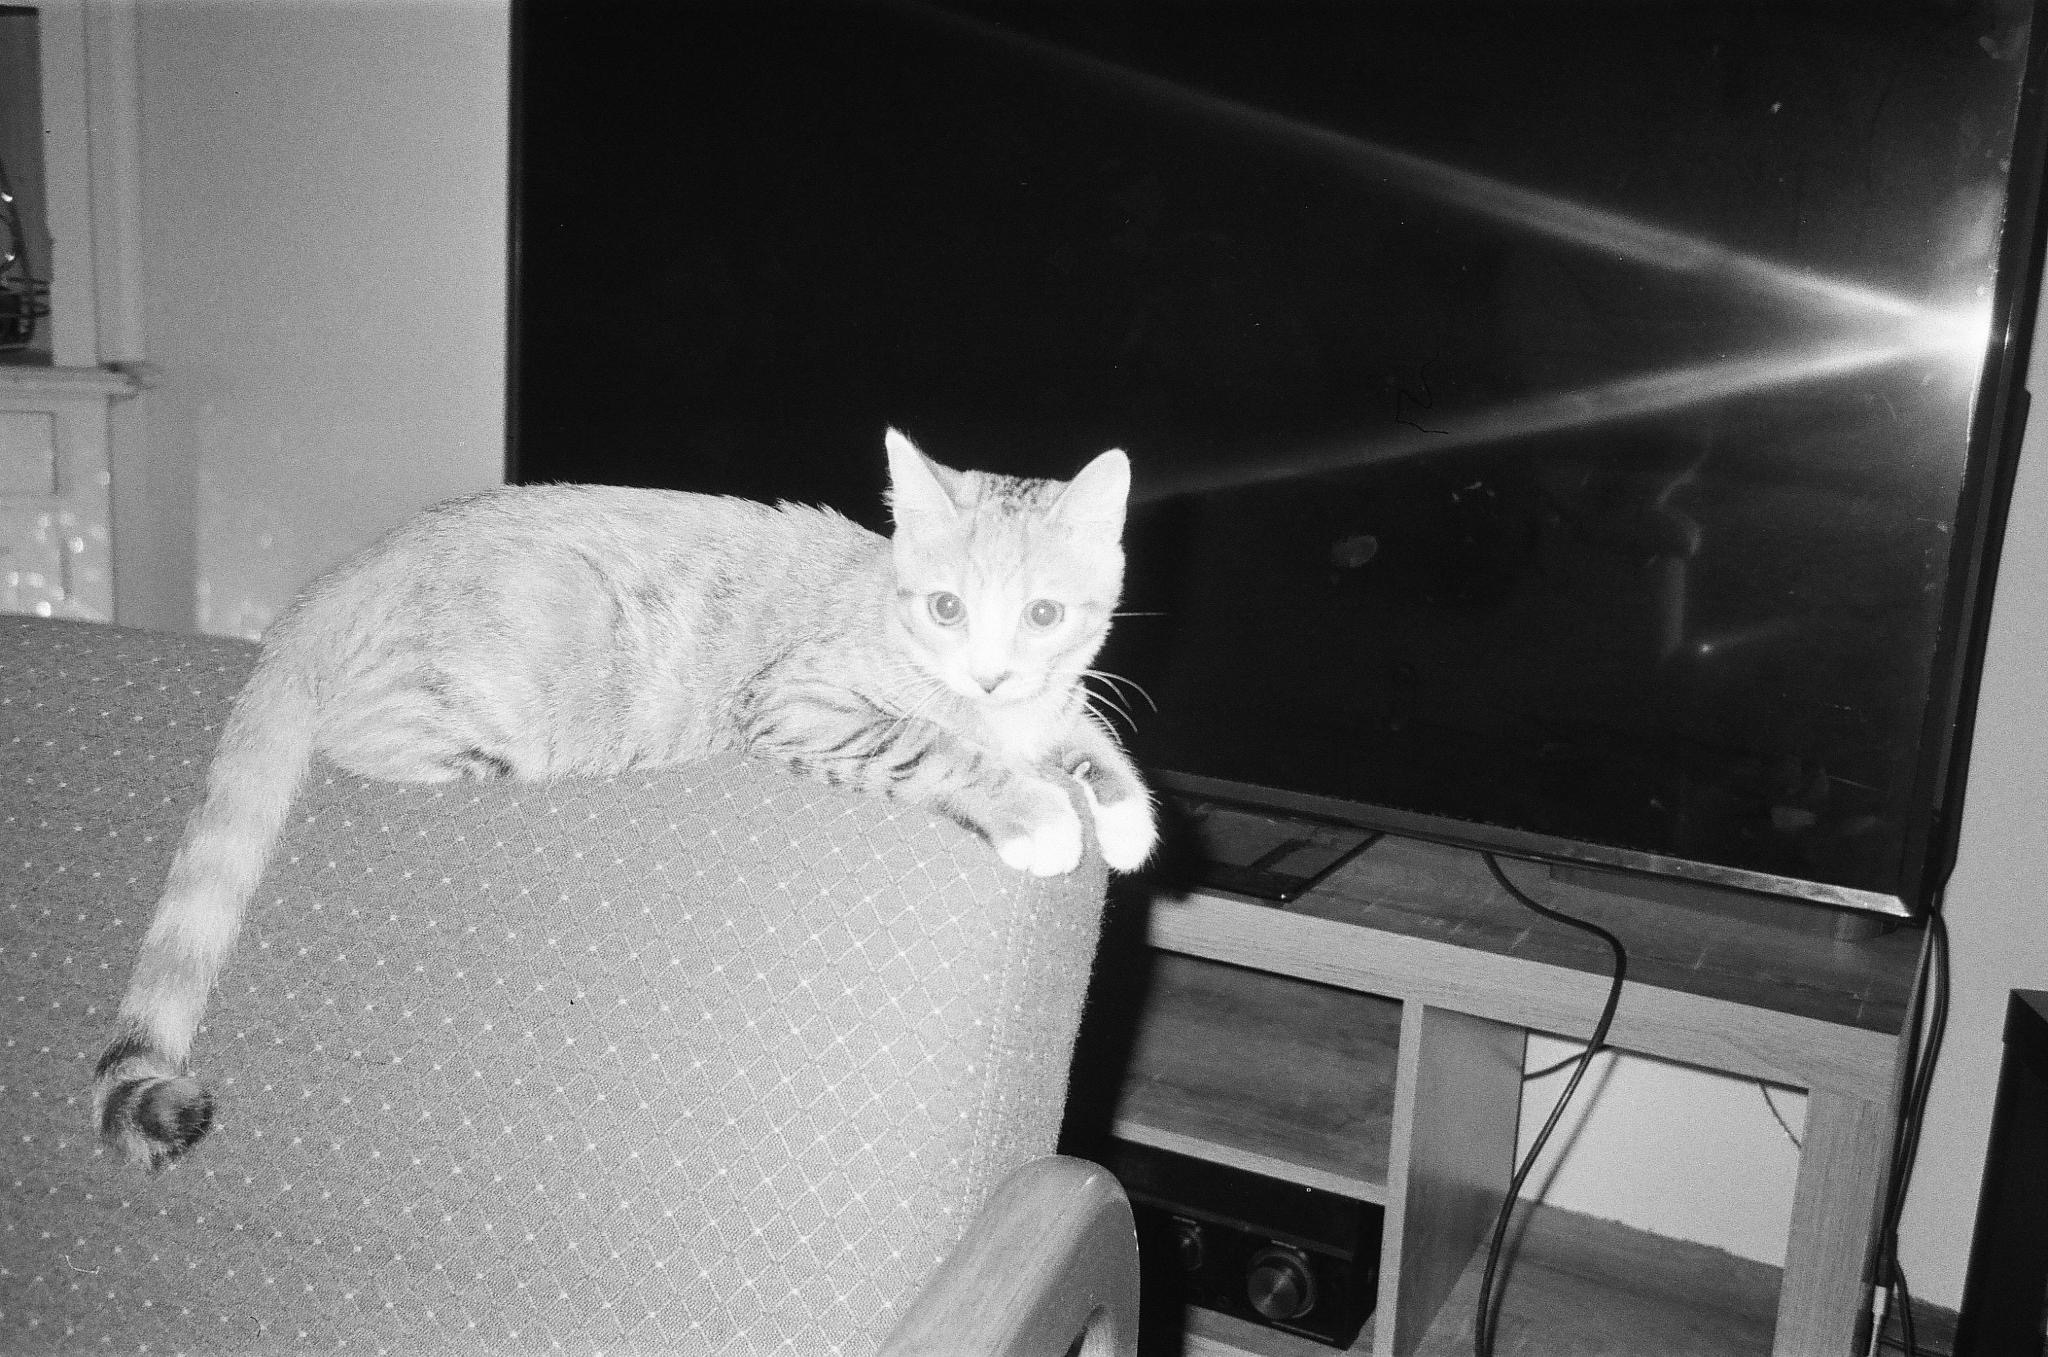
Cat tax:
Part II: Time
This one won’t take long. I was curious to see if the COVID-19 pandemic caused an uptick in pet license registration; after all, it sure felt like one of the top American pandemic coping mechanisms was getting an animal in the mix. Here’s a graph of total pet license registrations per year:
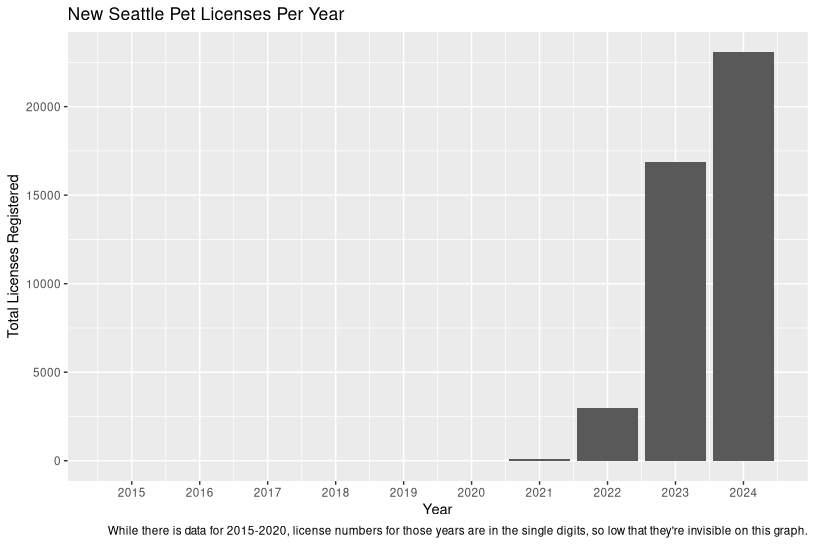
This graph, which surely can’t be an accurate depiction of how many pets have been adopted per year since 2015, instead points at a different story: that pet licenses must be renewed at least every two years. A quick Google confirms this. If anything, this is a great example of how data analysis can lead to further discovery! At least that’s what I’m telling myself.
Part III: Location
Our last visualization is interactive! Woohoo! Get in there.
This graph shows how many pets are registered in each Seattle ZIP code per 100 people living there. Pet population data was calculated from the dataset. Human population is pulled from the latest Census data.
It’s hard to pull out any exact trends from this map. In general, downtown seems to have fewer pets per person. If I had to hazard a guess, I’d say that higher population density in those areas means that people have less space to themselves and therefore less space for any potential pets. The northern parts of the city have quite a high ratio compared to everyone else, which may be driven by the inverse of the situation that was just described.
One other striking takeaway is that the absolute peak of pets per 100 people hovers right around 8. Estimates of the total number of cats and dogs in the U.S. are around 160 million. That’s roughly 48 per 100 population. You tell me what’s more likely: Seattle has 1/6th the average amount of pets compared to the rest of the country, or people don’t feel like paying for pet licenses. I know what my money’s on.
Future Work
One additional direction that I think could be interesting for this project is incorporating more data about the people who live in the aforementioned zip codes. If I had more time, I’d like to examine how socioeconomic trends throughout Seattle affect pet ownership - or, at least, how they affect pet license purchasing. It would also be fantastic to have more thorough data on local pet populations, so if we’re talking unlimited resources, that’s what I’d go for. I’m sure there are other threads of investigation that could be pursued with the data currently available - for instance, it’d be fun to take a look at whether people in certain parts of the city are more likely to name their pets something unique. That being said, I’m happy with how this turned out, and I hope you had fun reading!